The challenge
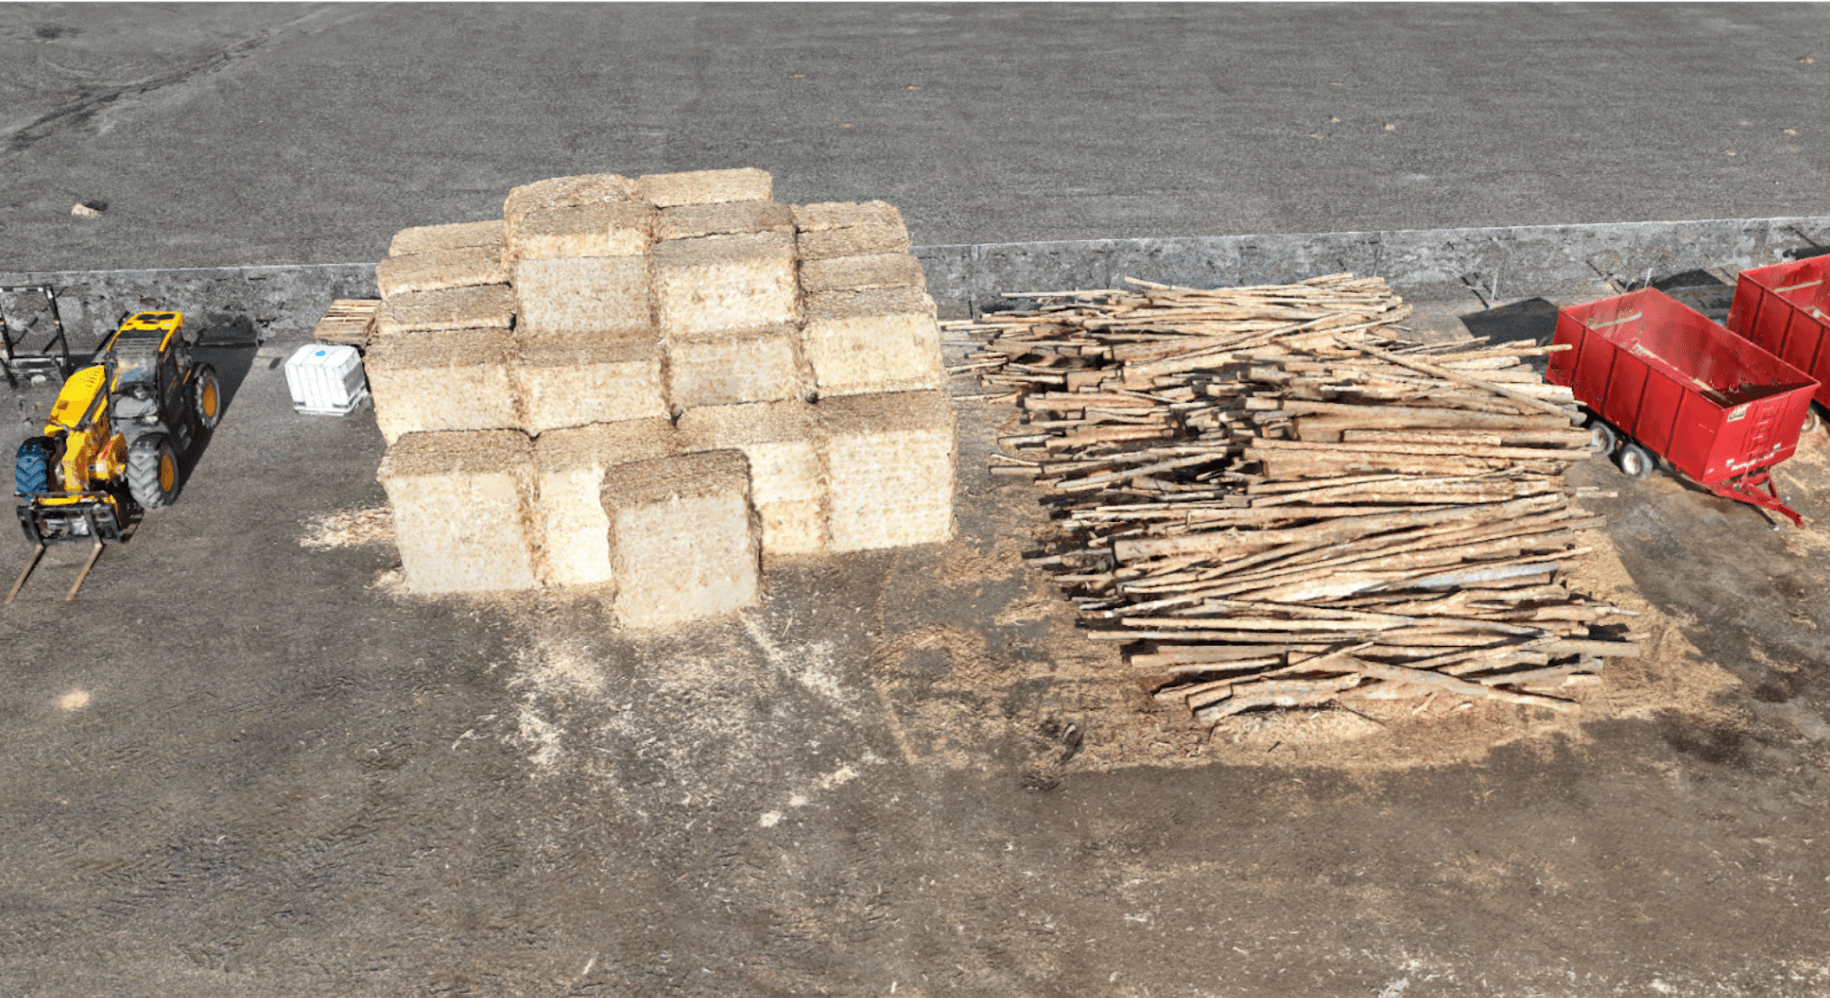
Charm's biomass doesn't show up in neat containers with barcodes. Log piles arrive in different sizes from forest thinning projects. Corn stover gets baled into cylinders or squares and hauled to their site. All of it ends up stacked on sloped, uneven ground — not on a perfectly flat slab.
Every pile is different. The geometry varies. The moisture varies. The packing density varies. Even the ground underneath varies. And when you're running a diversified supply chain — wildfire residue in one location, corn stover in another — that variability adds up fast.
Traditional methods rely on visual estimates, loader counts, or bulk volume approximations layered with assumptions. Truck scales help with what enters and exits, but knowing how inventory changes over time? That's where things get tricky.
How Rebulk helped
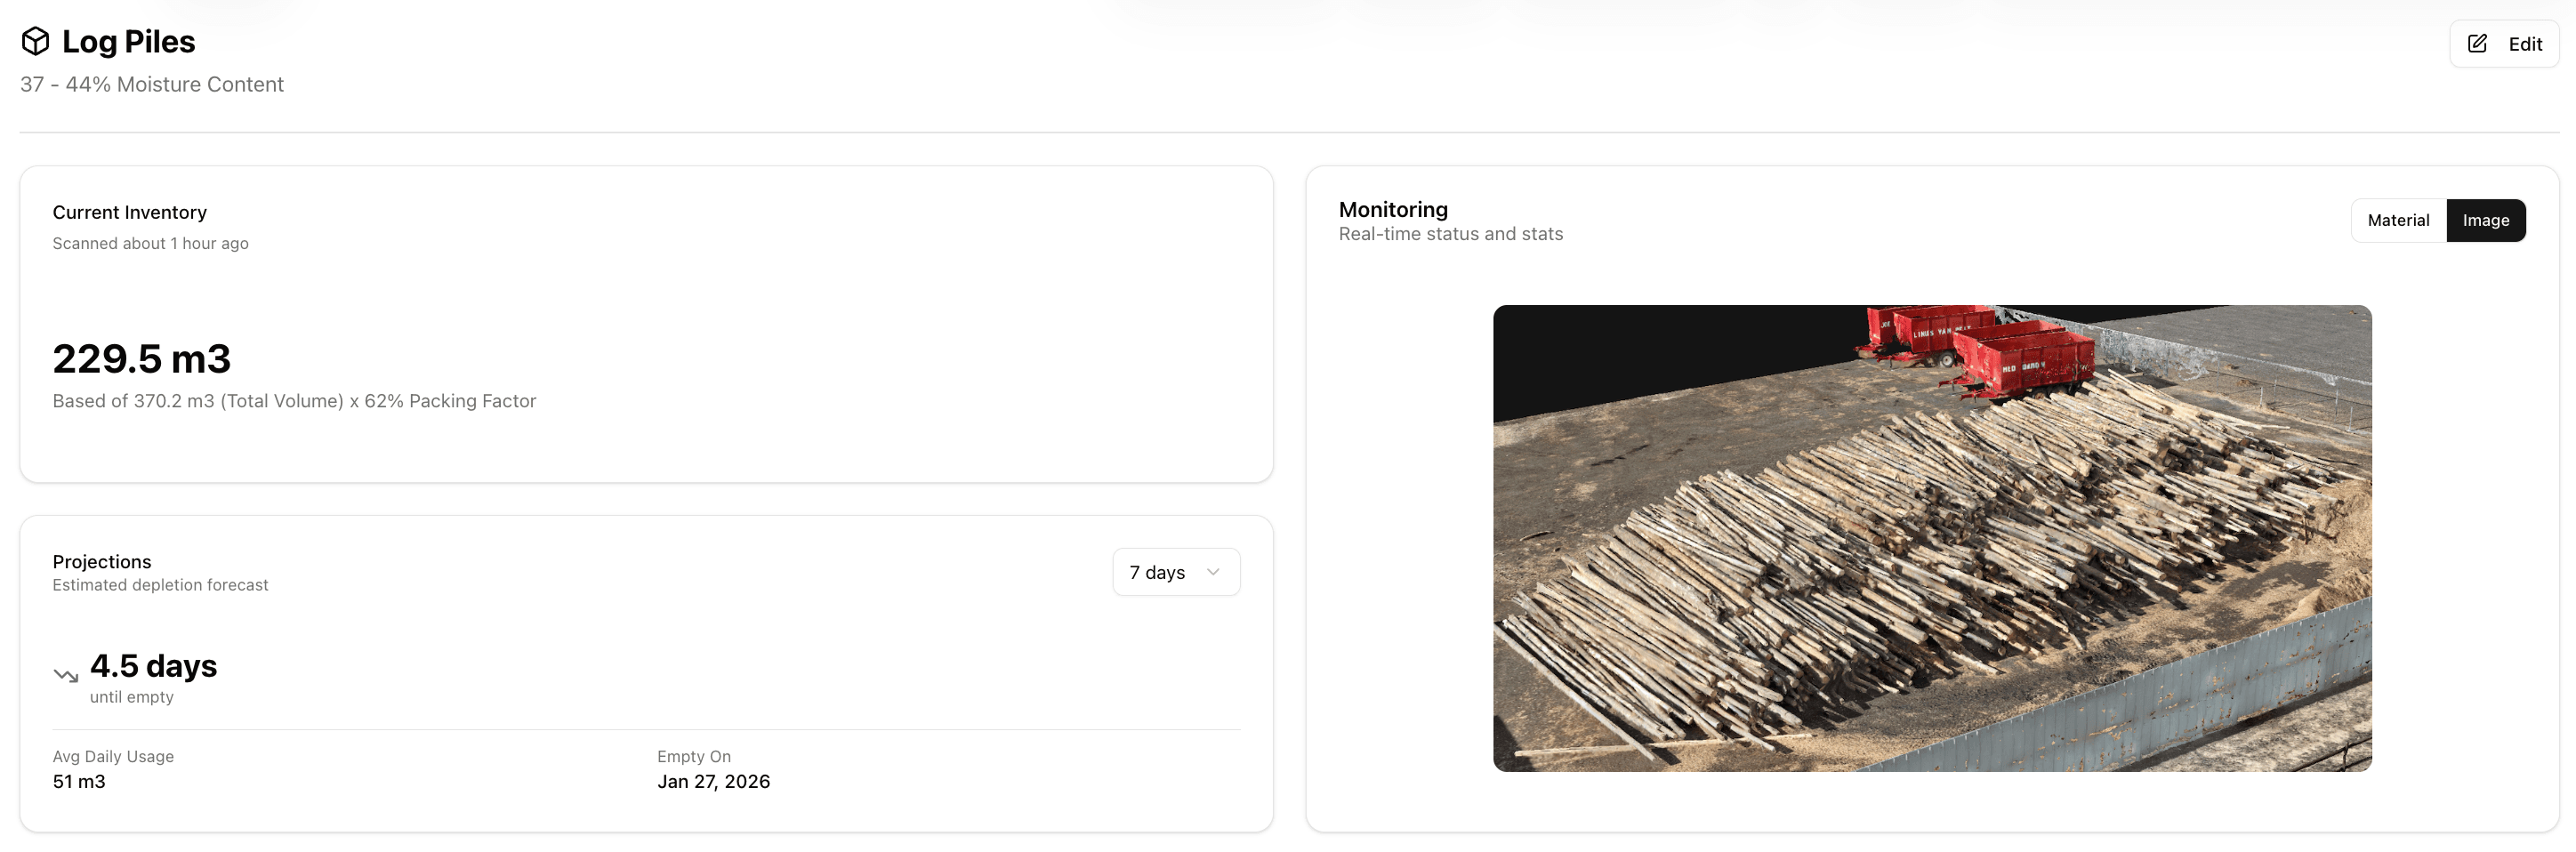
Rebulk gave Charm two things they couldn't get from spreadsheets or eyeballing: accurate 3D volume models of their piles, and a way to figure out how much of that volume is actually usable biomass versus air gaps.
Here's how it works:
3D pile reconstruction
Using drone or mobile photos, Rebulk stitches overlapping images into a dense 3D model of the pile and the yard around it. It also models the actual ground surface underneath — because biomass yards are rarely flat, and even small baseline errors distort volume estimates at scale.
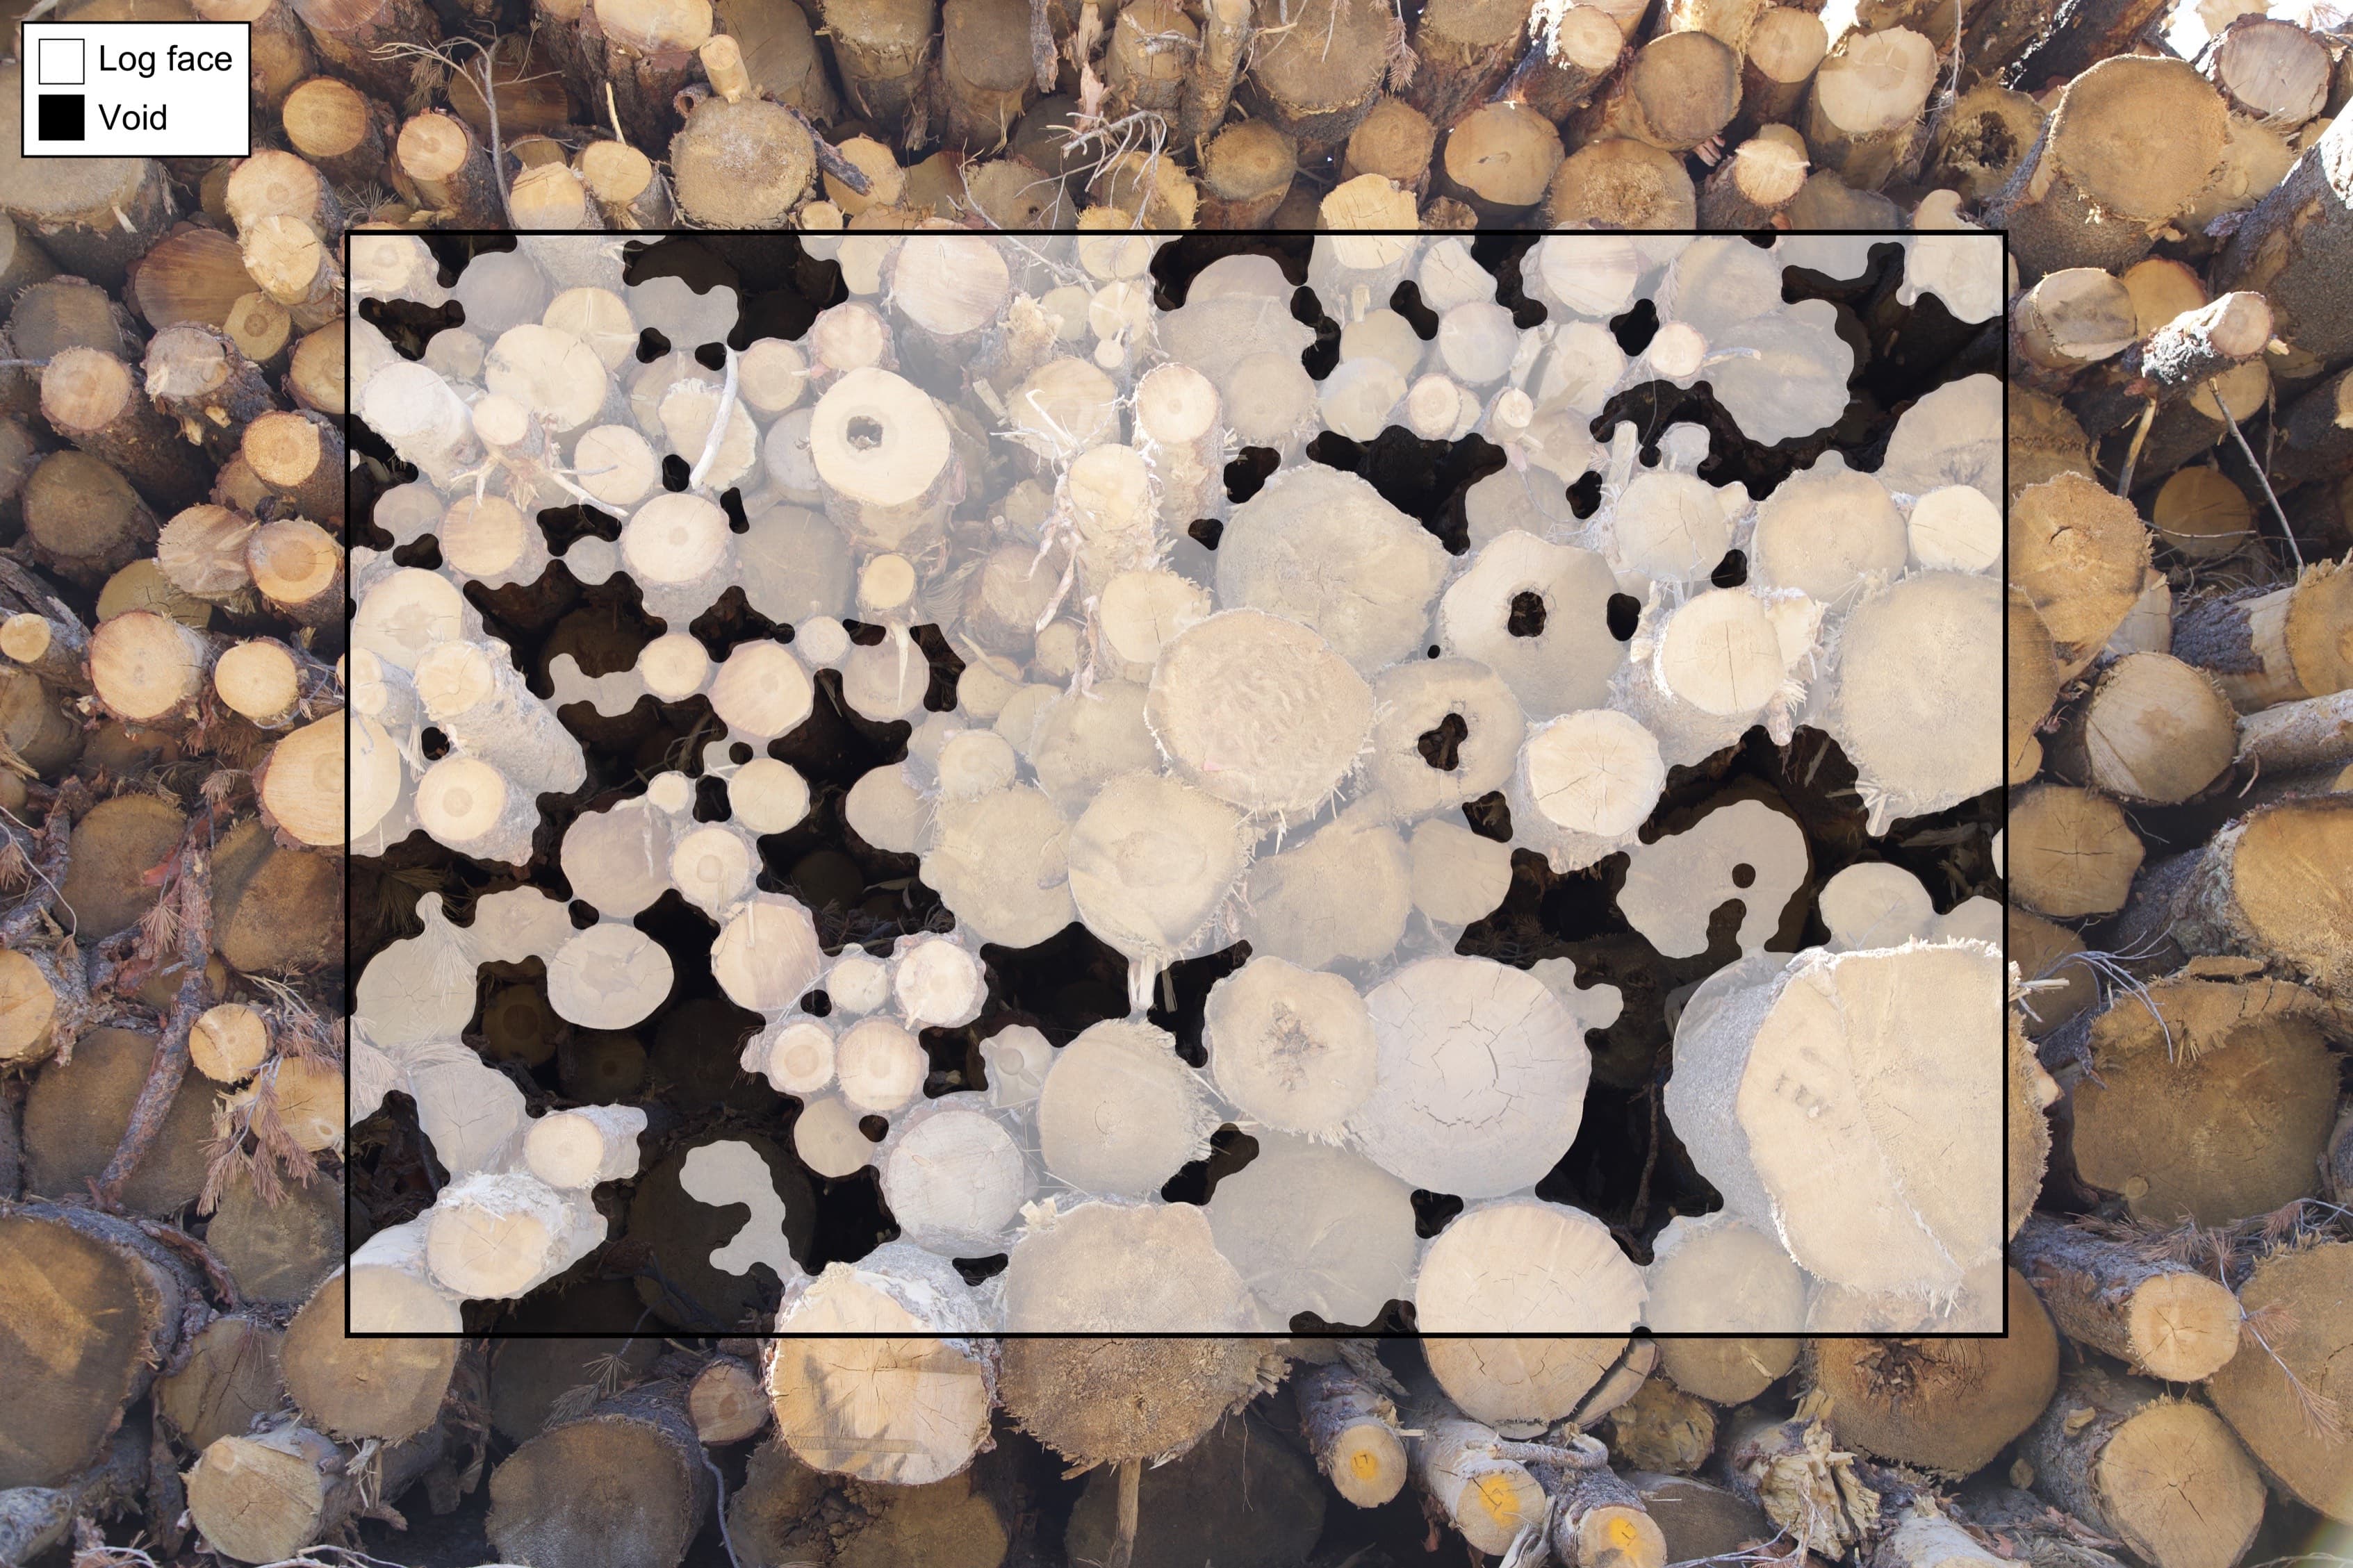
Packing factor estimation
Bulk volume alone doesn't tell the whole story. Biomass piles have air gaps between logs, branches, and stalks. Rebulk uses computer vision on side-view imagery to estimate the void fraction — how much of the pile is solid material versus empty space.
The math is simple:
Bulk Volume × Packing Factor = Usable Material Volume
This lets Charm compare piles with totally different internal structures in a consistent way.
The whole workflow is built for the field. Charm's operators capture scans with standard mobile devices and sync them later — which matters a lot when your sites are in mountainous Colorado with spotty cell service.
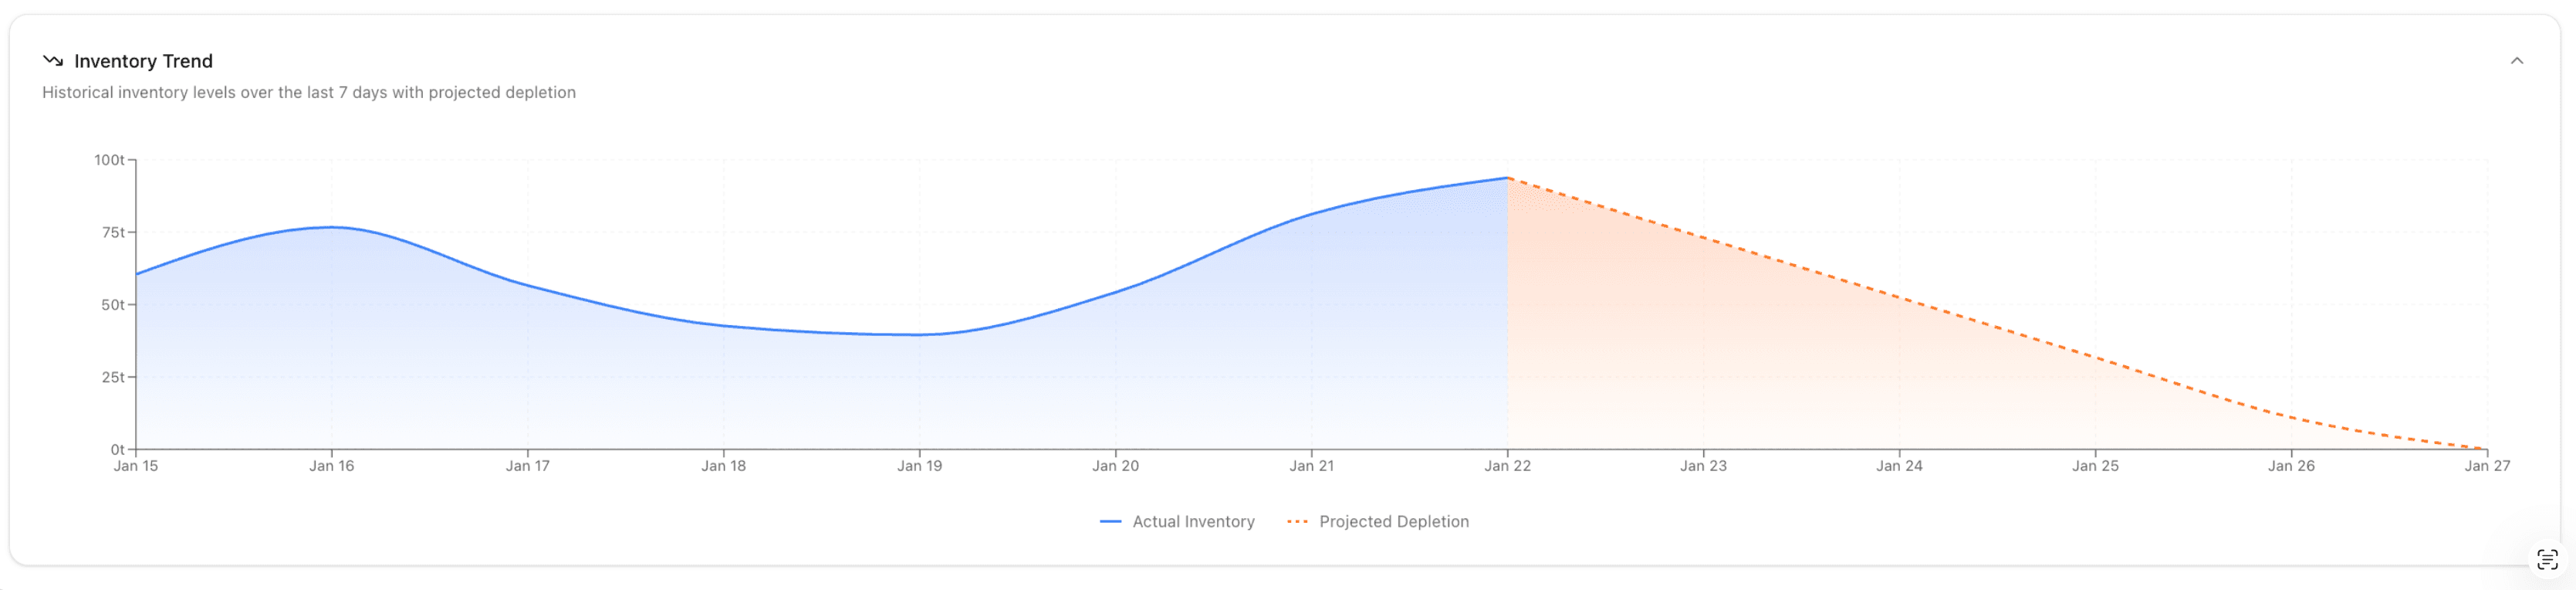
But the real win isn't any single scan. It's what happens when you stack them up over time: you get a time-series inventory system that tracks how piles grow, deplete, and move. That feeds into forecasting, logistics planning, and structured data from biomass origin all the way through processing.
The impact
With Rebulk, Charm can now:
“Carbon removal doesn't start at the wellhead. It starts with feedstock. Accurate measurement turns irregular piles into actionable data. Actionable data supports better operations. Better operations support scale. And scale is the whole point.”
— From Charm Industrial's blog post about working with Rebulk
See how it works in your operation
Whether you're managing log piles, stover stacks, or other irregular biomass — Rebulk helps you measure what you actually have, track how it changes, and plan with real numbers instead of estimates.